


2020-01-04 by Quick Biology Inc.
GWAS (Genome-wide association study) is an approach to associate genetic variants with traits (such as human height, or even diseases). However, every cell in your body has the same DNA. It is a challenge of using GWAS to identify which type of tissue or cell types associated with certain diseases. In recent Nature communications, researchers in Broad and MIT performed massively parallel single-cell RNA sequencing in two platforms: droplet-based microfluidics and nanowell-based Seq-well (ref 1). Using age-related macular degeneration (AMD) as a study model, they reported the first single-cell transcriptomic atlas of the human retina. By analyzing single-cell atlas, they constructed detailed cell subtypes in the retina (Fig. 1), and cell-type gene expression signatures (Fig. 2). Furthermore, utilizing previous published large GWAS study (sample size > 15, 000) of AMD, they linked risk loci of AMD with patterns of retina cell-type specific gene expression. Through in situ hybridization, authors validated the cell type preferential expression of such as CFI, TIMPS (Fig. 3). This work provides us a great strategy of translating GWAS data to biological cellular mechanisms.
Figure 1: (Left) Sketch of retina cross-section showing layers and major cell. (Right)Cell-to-cell similarity network of retinal cells.

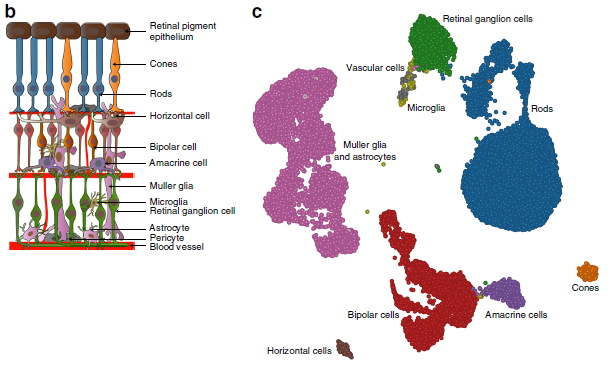
Figure 2: Average expression of known cell-type marker genes across cell groups.
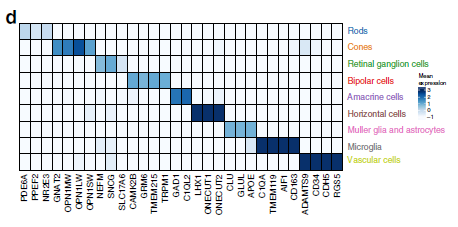
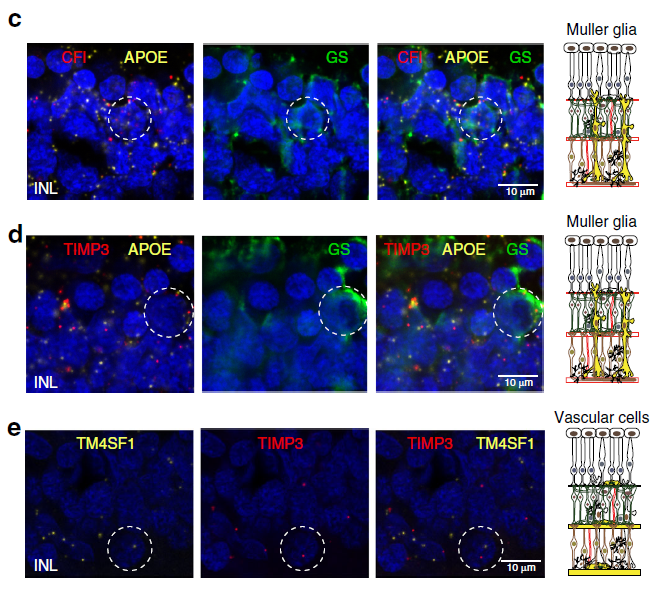
Figure 3: Expression pattern of AMD risk alleles CFI and TIMP3 in the human retina. Representative images of multiplex in situ hybridization with immunofluorescence of c APOE (labeled in yellow, identifies Müller glia), CFI (labeled in red) and glutamine synthetase (GS, identified in green); d APOE (labeled in yellow, identifies Müller glia), TIMP3 (labeled in red) and glutamine synthetase (GS, identified in green), and e TM4SF1 (labeled in yellow, identifies vascular endothelium) and TIMP3 (labeled in red). White dotted circles indicate double positive cells.
Quick Biology is an expert in NGS applications. Find More at Quick Biology.
Ref:
1. Menon, M. et al. Single-cell transcriptomic atlas of the human retina identifies cell types associated with age-related macular degeneration. Nat. Commun. 10, (2019).