2020-09-14 by Quick Biology Inc.
The cell surface is the crucial interface between cell-cell and cell-environment interactions. These interactions involve extracellular signal sensing, extracellular matrix anchoring, or antigen presentation. The key bioactive molecules in these cell surface functions are transmembrane proteins, glycans, or lipids. In contrast, the contribution of RNAs to the cell functions is largely unknown.
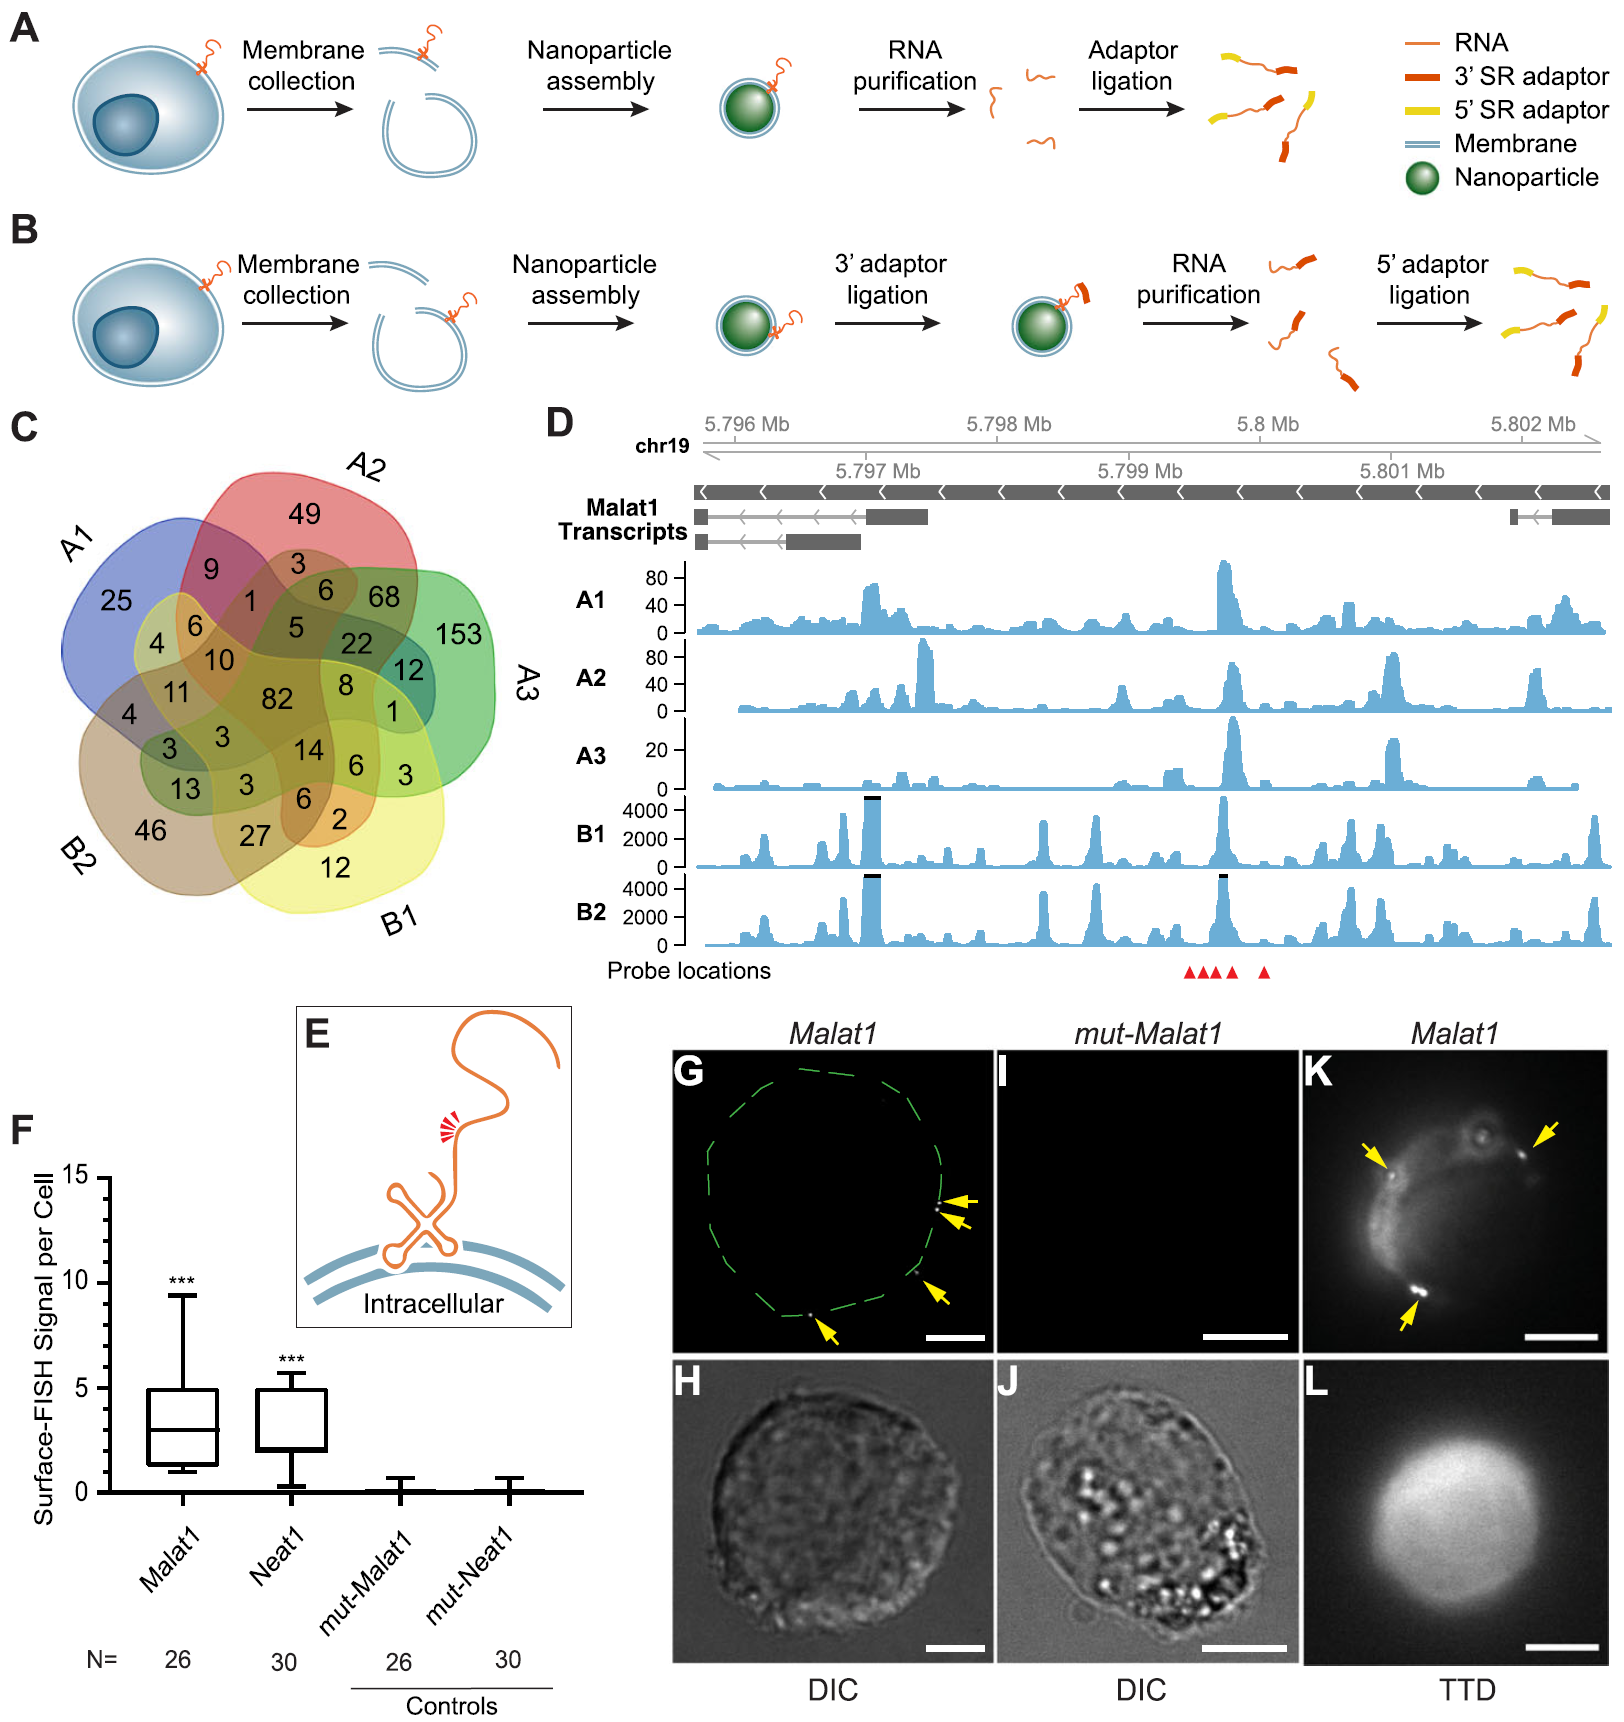
In Genome Biology, Dr. Zhong’s Lab (http://systemsbio.ucsd.edu/index.html#home) at UCSD developed a technique called Surface-seq to sequence membrane-associated extracellular RNAs (maxRNAs). Basically, they extracted the plasma membrane from cells and tightly assembled the membrane around polymeric cores to form membrane-coated nanoparticles (MCNP), which is a type of nanotechnology. This polymeric core can ensure the rigorous removal of intracellular contents while the cell membrane is stably coated. Extracted RNAs from extracellular membranes were then as the input of the Surface-seq library construction and sequencing (Fig.1).
To prove maxRNAs are real functional molecules, the authors did RNA in situ FISH (evidence of maxRNAs existence), the specificity of cell types (function association), and anti-sense oligo RNA block perturbation. Although, there are so many open questions of maxRNAs, their data highlight maxRNAs as functional components of the cell surface, suggesting an expanded role for RNA in cell interactions.
Fig. 1: Sequencing and validation of maxRNA from a cell line. a, b. The workflow of the two variations of Surface-seq. c. A Venn diagram of the noncoding RNAs identified by the 5 Surface-seq experiments, indexed by A1, A2, A3 (based on Surface-seq variation A), and B1, B2 (based on Surface-seq variation B). d. Read coverages from the 5 Surface-seq libraries on the MALAT1 gene, indexed by A1, A2, A3, B1, and B2. Red arrowheads: locations of Surface-FISH probes. e. A hypothetical model of the relative positions of Surface-FISH probes (red arrowheads) on a membrane-bound Malat1 RNA fragment. f Box plots of the numbers of Surface-FISH signal foci per cell (y-axis) for Malat1, Neat1, and two controls (mut-Malat1, mut-Neat1) (columns). N: number of cells examined. g, h Malat1 Surface-FISH (g) and DIC image of the same cell (h). The green dashed lines outline the rim of the cell. i, j Control probeset mut-Malat1 Surface-FISH (i) and DIC images of the same cell (j). k, l Malat1 Surface-FISH (k) and transmission-through-dye (TTD) image of the same cell (l). Arrows: Malat1 Surface-FISH signals. The TTD image was produced by a membrane-permeable dye used in conjunction with a membrane-impermeable quencher, indicating a cell with an intact cell membrane. Scale bar = 5 μm. Probe signals were compared against corresponding controls. ***p value < 0.0001. (Ref.1)
Quick Biology is an expert for Next Generation sequencing applications. Find More at Quick Biology.
Ref:
- Huang, N., et al. (2020) Natural display of nuclear-encoded RNA on the cell surface and its impact on cell interaction. Genome Biology. doi.org/10.1186/s13059-020-02145-6.