2020-02-09 by Quick Biology Inc.
Next generation sequencing evolves into such a large ‘postgenomic’ era. NovaSeq -- a llumina sequencer can collect an entire human genome for < $1000 in several days. Now, it is a big challenge to interpret the data and how to get useful information from such a long A, T, G, C string.
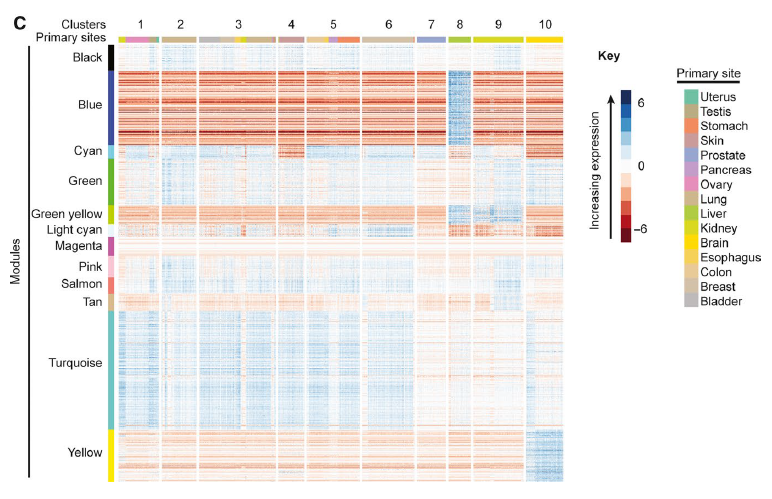
In recent J Cell Mol Med, Researchers from Sanford Imagenetics comprehensively analyzed RNA-seq data from (a) TCGA (https://www.cancer.gov/about-nci/organization/ccg/research/structural-genomics/tcga), a human cancer dataset, (b) TARGET (https://ocg.cancer.gov/programs/target), a childhood cancer dataset, (c) GTEx (https://www.gtexportal.org/home/), a non-disease human tissue dataset. They hypothesized that gene expression changes by some diseases’ hallmarks, can be used as relevant therapeutic targets. By using weighted correlation network analysis (WGCNA, https://horvath.genetics.ucla.edu/html/CoexpressionNetwork/Rpackages/WGCNA/) (Fig.1), the authors stratified tumors according to certain ‘ modules’ such as T cell activation, NK-cell activation, etc. signaling. Their results supported that cancers can be classified into molecular subtypes defined by expression of transcripts; this clustering is primary site-independent (Fig. 2).
Figure 1: A flowchart depicting the Pan-cancer RNA-seq analysis. Transcriptome profiles were first restricted to protein‐coding genes (A), then two different primary site‐correction approaches were taken to analyse the three data sets in parallel (B). Each data set was analysed using WGCNA to identify groups of genes (modules) that were co‐correlated, and variable across cancers (C). Genes found in modules were put through pathway enrichment analysis (WebGestalt) and used for hierarchical clustering (D).
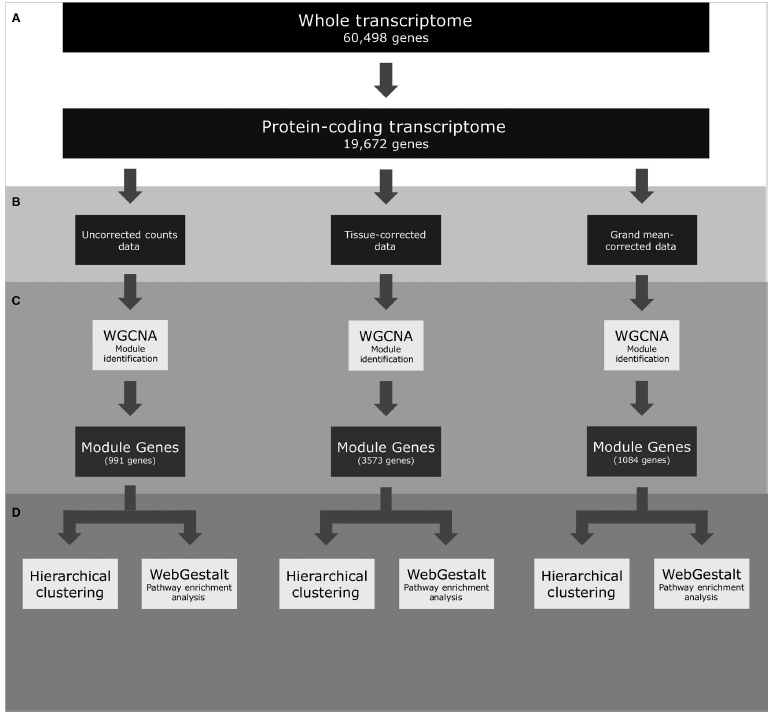
Figure 2: Heatmaps of module expression within cancer clusters. Heat maps of module expression within cancer clusters. Heat maps are shown for (C) grand mean corrected RNA‐Seq data. WGCNA identified modules (left color bar) are composed of protein‐coding genes with TPM values co‐correlated and variable across cancers. Hierarchical clustering of the 1,084 genes in grand mean‐corrected WGCNA modules defined 10 clusters. These clusters were characterized by distinct expression of modules.
Quick Biology is an expert in the transcriptome, genomes, and proteomics area. Find More at Quick Biology.
Ref:
1. Frost, F. G., Cherukuri, P. F., Milanovich, S. & Boerkoel, C. F. Pan-cancer RNA-seq data stratifies tumors by some hallmarks of cancer. J. Cell. Mol. Med. 24, 418–430 (2020).