2020-12-14 By Quick Biology
Human cancer cell lines have been a driving force in cancer research. The NCI-60 Human Tumor Cell Lines cover 60 different human tumor cell lines, representing leukemia, melanoma, and cancers of the lung, colon, brain, ovary, breast, prostate, and kidney cancers (ref1). The Cancer Cell Line Encyclopedia (CCLE) project started in 2008 as a collaboration between the Broad Institute, and the Novartis Institutes for Biomedical Research, and its Genomics Institute of the Novartis Research Foundation (ref2). NCI-60 contains data of growth inhibition or cell death of 60 different cancer cell lines when exposed to compounds. CCLE contains genomics data of gene expression, DNA mutations of many cancer cell lines. However, such characterization of either NCI-60 or CCLE is limited to the cell culture model. In 2016, after more than 25 years of heavy use, the US National Cancer Institute has decided to retire the NCI-60, the cancer cell lines grow in culture from its drug-screening program. It is highly required to construct a map of organ-specific metastatic potential of cancer cell lines using the Xenograft model.
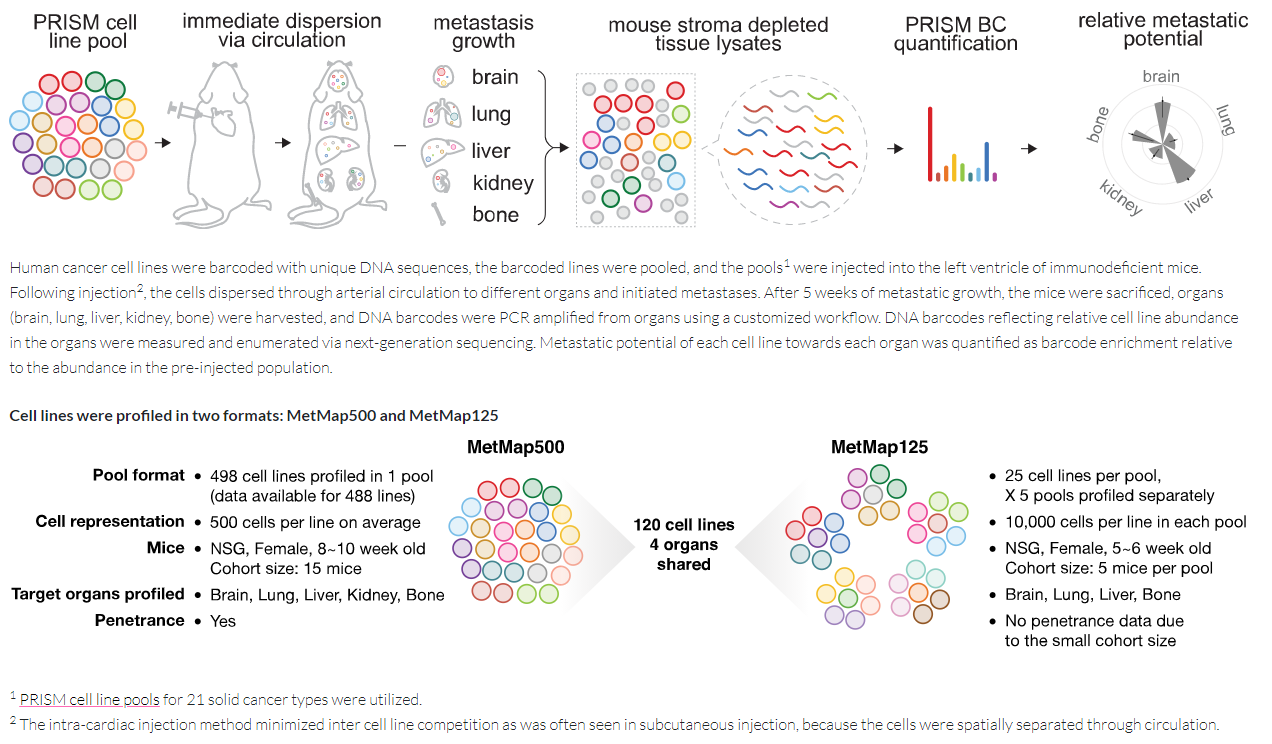
In recent Nature (cover story), Golub lab at Broad Institute performed an in vivo barcoding strategy that can determine the metastatic potential of human cancer cell lines in mouse xenografts at scale. Basically, using lentivirus transduction, they engineered each cell line to express a unique 26-nucleotide barcode, together with luciferase for in vivo imaging and either GFP or mCherry to facilitate subsequent cell sorting and measurement of reproducibility within a single mouse. The barcoded cell lines were then injected as a pool into the left ventricle of 5-6-week-old NOD-SCID-gamma mice. After injection, different tissues were collected and isolated by sorting. RNA-sequencing was performed to track down cell line barcodes, enrichment of barcodes was inferred as each cell line’s metastasis potential (ref3, Fig.1). Researchers applied this strategy to 500 cell lines spanning 21 types of solid tumor. From this big data, they created a first-generation metastasis map (MetMap, ref 4) that reveals organ-specific patterns of metastasis, enabling these patterns to be associated with clinical and genomic features. More importantly, they demonstrate the utility of MetMap by investigating the molecular basis of breast cancers capable of metastasizing to the brain --- a principal cause of death in patients with this type of cancer. Breast cancers capable of metastasizing to the brain showed evidence of altered lipid metabolism. Perturbation of lipid metabolism curbed brain metastasis development, suggesting a therapeutic strategy to combat the disease and demonstrating the utility of MetMap as a resource to support metastasis research.
Figure 1: Schematic Diagram of in vivo metastasis.
Quick Biology can assist you with the barcoded cell pool sequencing. Find More at Quick Biology.
See resource:
- 1. NCI-60: https://dtp.cancer.gov/discovery_development/nci-60/
- 2. CCLE: https://depmap.org/portal/ccle/
- 3. Jin, X. et al. A metastasis map of human cancer cell lines. Nature 588, (2020).
- 4. MetMap: https://depmap.org/metmap/index.html