2020-06-22 by Quick Biology Inc.
Quantitative trait locus (QTL) analysis is to identify which molecular markers correlate with an observed trait, bridging the gap between genes and the phenotypic traits. Genome-wide association studies using DNA level variants (e.g. single nucleotide polymorphism) is a powerful tool for QTL mapping. However, DNA level variants may not be the causal variants, they might just hitchhike with causal variants, or they function as trans factors, indirectly regulate in a distal genome region. Message RNA is the intermediate level between genetic materials (DNA) and phenotypic traits (protein). Using RNA level variants (i.e. transcript expression level, eQTL) has its unique advantage: they are more associated with traits. One vivid example is that our body has tissue-specific transcript patterns while sharing the same genome sequences.
In The Plant Cell, researchers at Michigan State University utilized transcriptome-based prediction of complex traits in Maize (ref1). As expected, transcripts and DNA marker models have similar performance, joint model increased traits prediction performance (Fig.1). Furthermore, some eQTLs cannot be simply interpreted by any local genetic markers, which indicates that these transcript markers cannot be captured by traditionally QTL methods (Fig.2). As researchers said, the transcript model identified 5, which genetic marker models only identified 1 of benchmark flowering-time genes in Maize. Using these transcript features (eQTL), scientists could improve Maize seed yield.
Figure 1: Relationships between Lines from Transcript and Genetic Marker Data. (Ref1). (A) Relationship between kinship-based on genetic marker data (x axis) and eCor (in PCC) based on transcript data (y axis). Boxplots show the median y axis value for each x axis bin (bin size50.15). (B) and(C)The relationships between lines based on eCor (B) or kinship (C) for all pairs of maize lines. Lines are sorted based on hierarchical clustering results using the eCor values. The blue, white, and red color scales indicate negative, no, and positive correlations, respectively. Dotted rectangles indicate clusters of lines discussed in the text. (D) and (E) The relationships between the Euclidean distance calculated with phenotype values (phenotype distance; y axis) and kinship (D) and eCor (E). Colored lines follow those in (A). (F) The relationships between lines based on phenotype distance, where the lines were sorted as in (B). Red indicates smaller distance (more similar) and blue indicates greater distances (less similar).
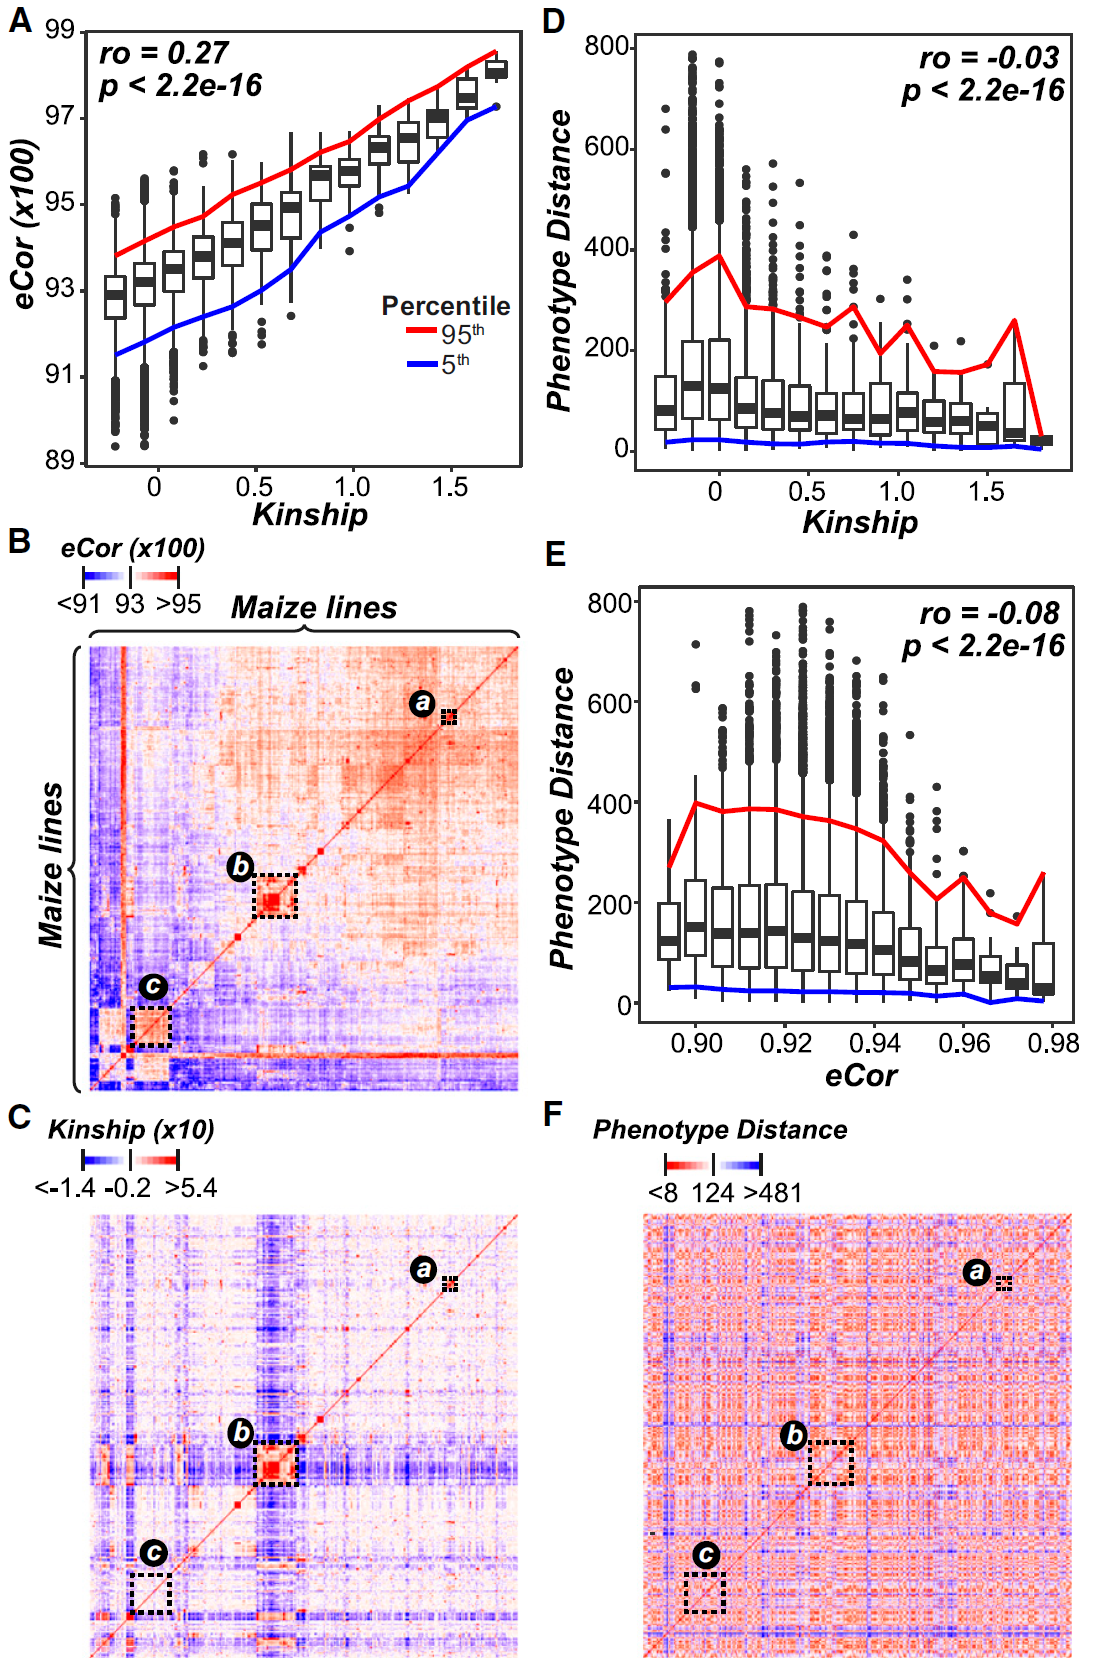
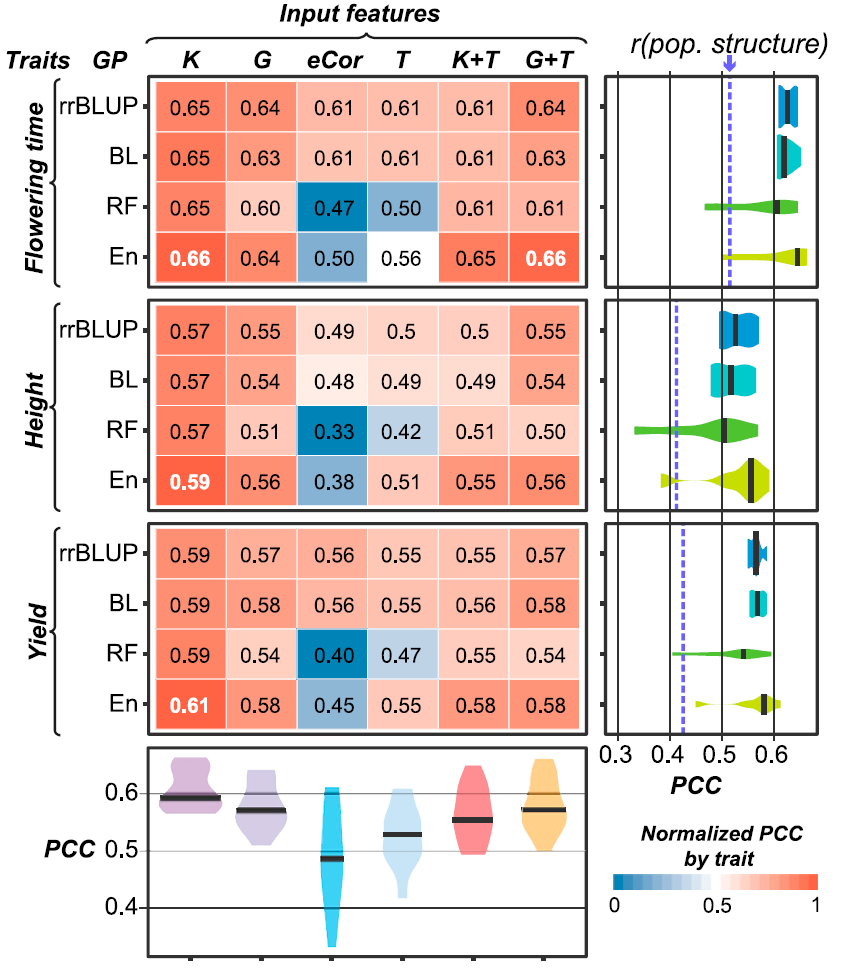
Figure 2: Genomic Prediction Model Performance. PCCs between predicted and true values for three traits and four algorithms using six different input features are shown. The text in each box represents the absolute PCC, with the best performing model for each trait in white. The box color represents the PCC normalized by trait, where the brightest red (1) corresponds to the algorithm/input feature combination that performed the best for the trait and the brightest blue (0) corresponds to the combination that performed the worst. Violin plots at right show the PCC distributions among different input features for each algorithm. The median PCCs are indicated with black bars. The model performance PCCs based on only population structure (first 75 principal components) are indicated with blue dashed lines. Violin plots at the bottom show the PCC distributions among different algorithms for each input feature.
Quick Biology is an expert in plant RNA-seq and NGS. Find More at Quick Biology.
Ref:
1. Azodi, C. B., Pardo, J., VanBuren, R., de Los Campos, G. & Shiu, S. H. Transcriptome-Based Prediction of Complex Traits in Maize. Plant Cell 32, 139–151 (2020).